alife-cadcad-research · visualization mockup gallery

Synthetic-data examples for the four early-experiment tracks in the proposal. Pick what to invest in; real data slots into the same templates. Regenerate any time with python3 generate_mockups.py.

→ Deep dive: Bonding curves as ALife organisms — 13 figures focused on RQ2, each tied to a paper in ../Papers/.

AcadCAD performance benchmarks

Drives the engineering deliverables (D1–D3). Lives in PRs, release notes, and the M2 milestone report.

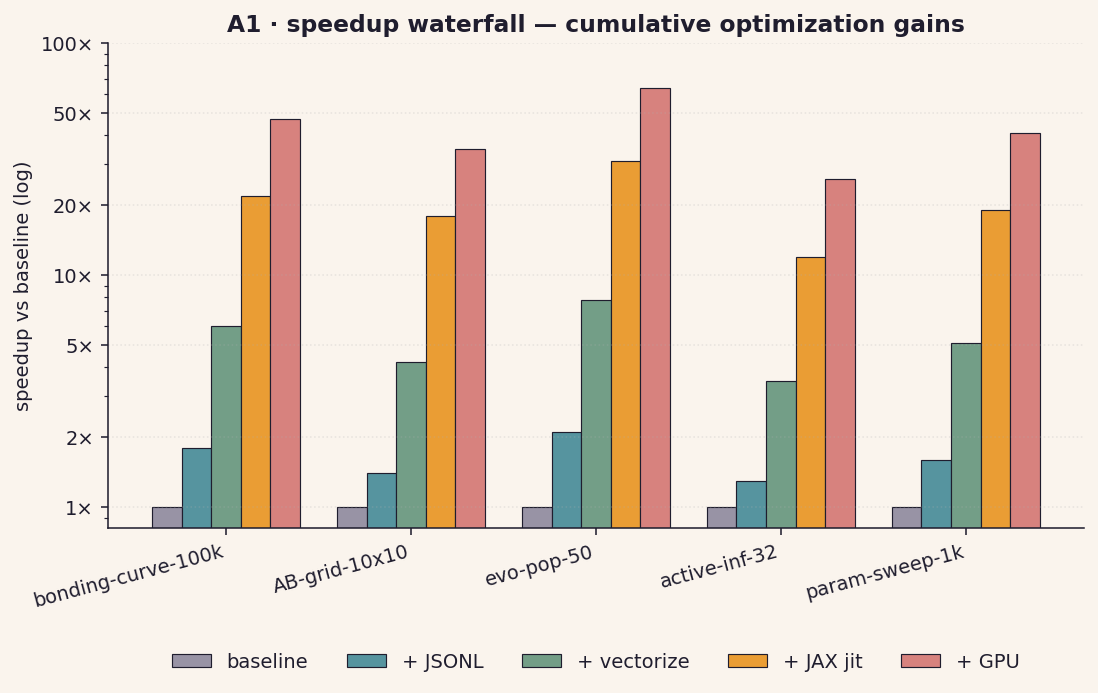
A1 speedup waterfall
A1Speedup waterfall
eng Stacked bars per benchmark, log-scaled — JSONL · vectorize · jit · GPU stacking up.
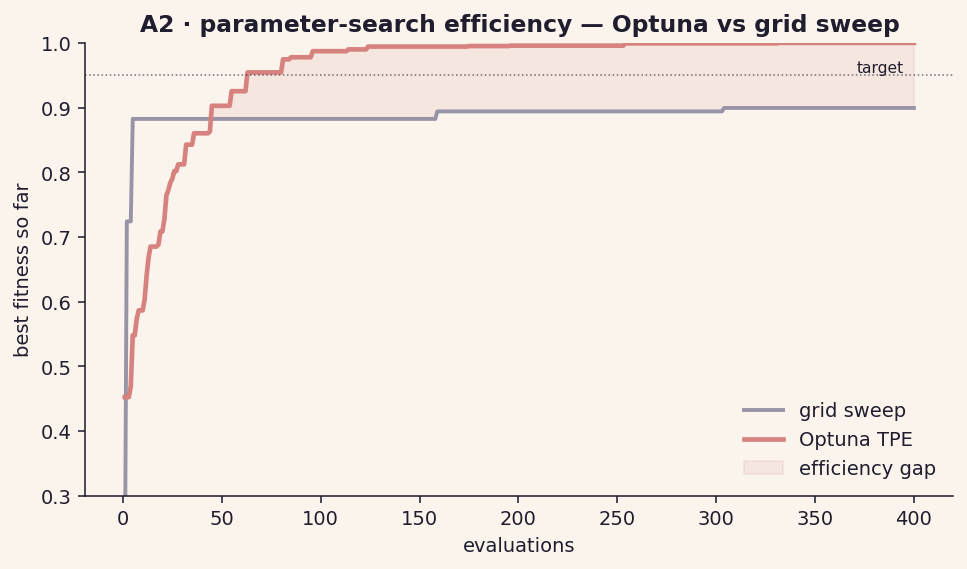
A2 Optuna vs grid
A2Optuna vs grid sweep
eng Best-fitness vs eval count. Sells the TPE story in one frame.
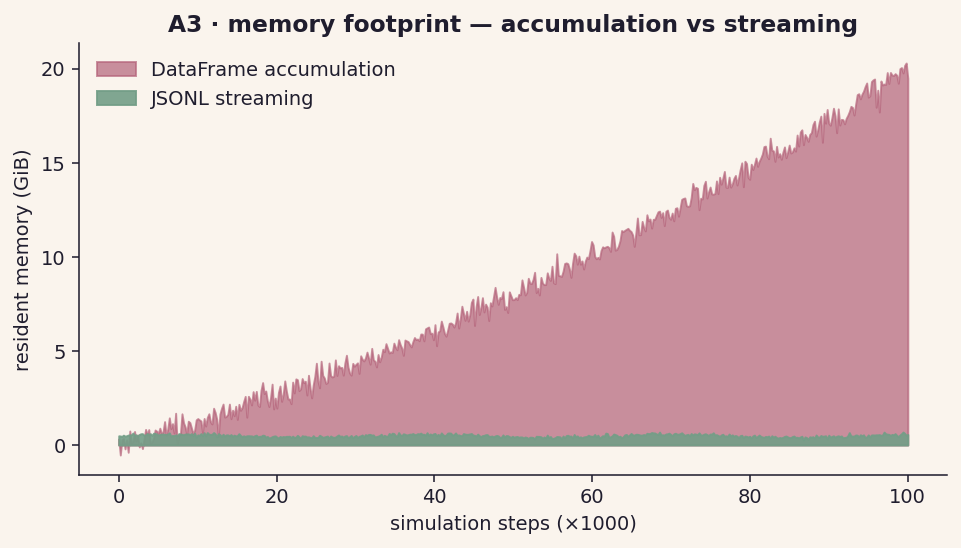
A3 memory footprint
A3Memory footprint
eng DataFrame accumulation grows quadratically; JSONL stays flat.
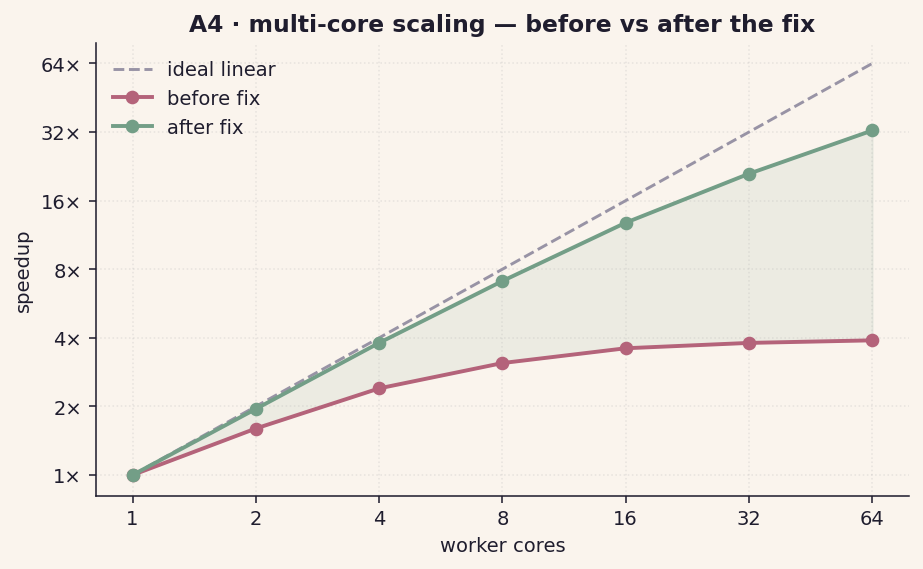
A4 multi-core scaling
A4Multi-core scaling
eng Speedup vs cores against ideal linear. The gap is the contribution.
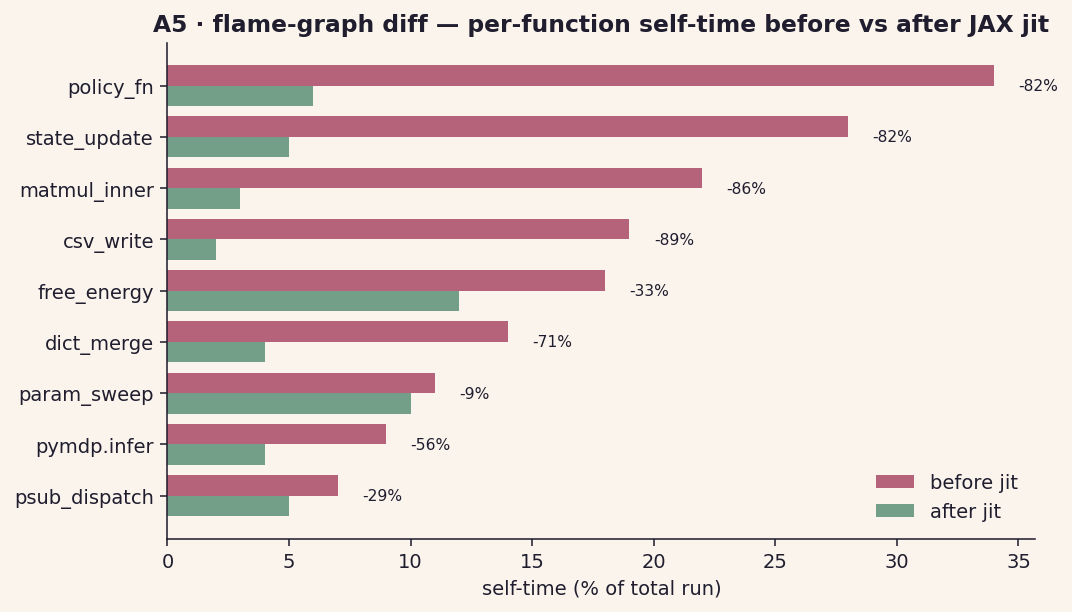
A5 flame diff
A5Flame-graph diff
eng Per-function self-time before/after jit, with % delta labels.
BEvolutionary cadCAD program search (RQ1)

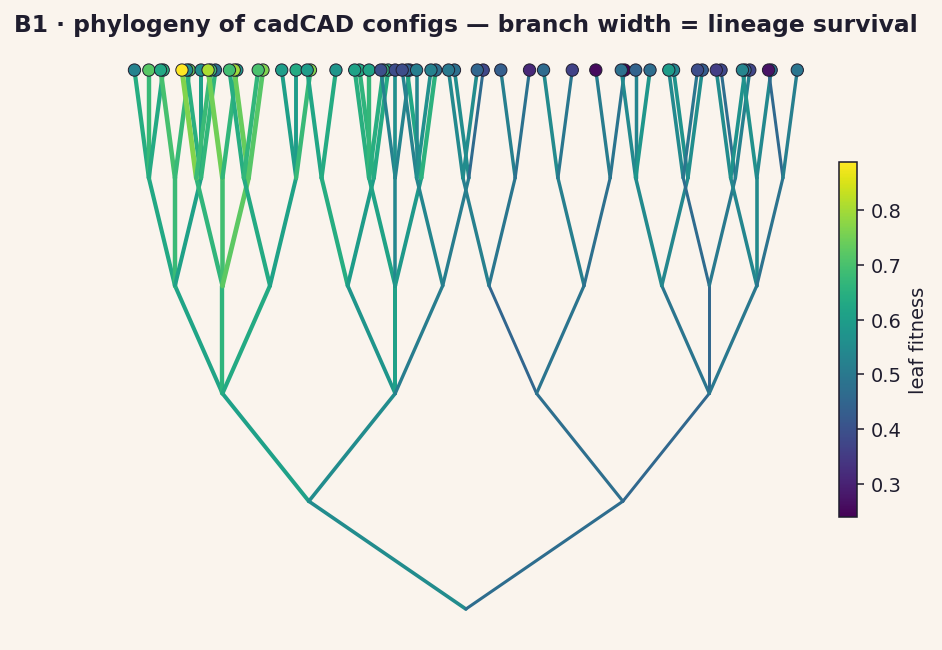
Population dynamics of cadCAD configs under PSUB swap / policy crossover / param mutation. The core empirical claim of the proposal.

B1 phylogeny
B1Phylogeny of configs
pub Branch width = lineage survival, leaf colour = fitness. The "did evolution work" picture.
B2 MAP-Elites
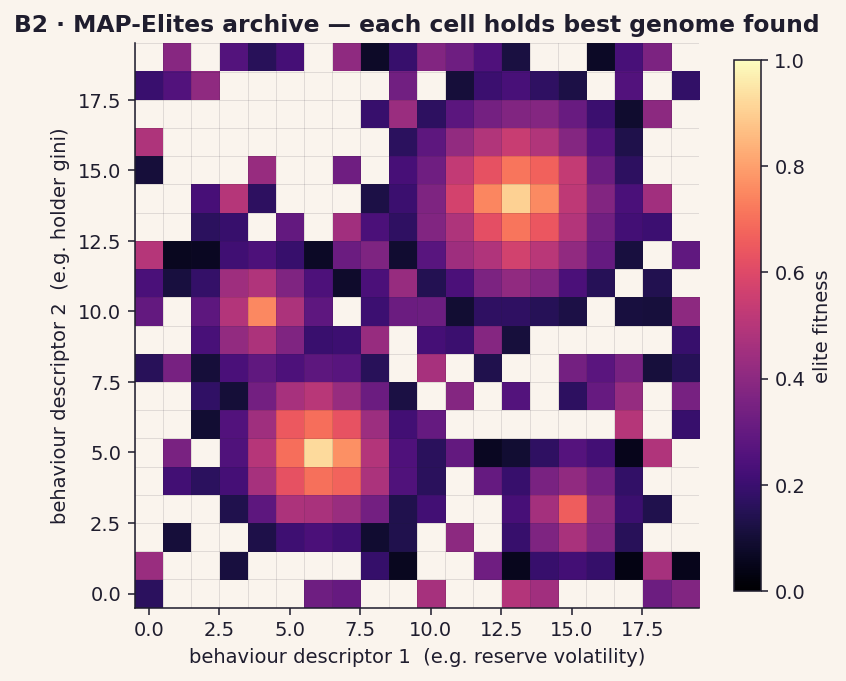
B2MAP-Elites archive
pub Behaviour-descriptor grid, elite genome per cell. Mirrors Anne et al. (Papers/).
B3 lineage heatmap
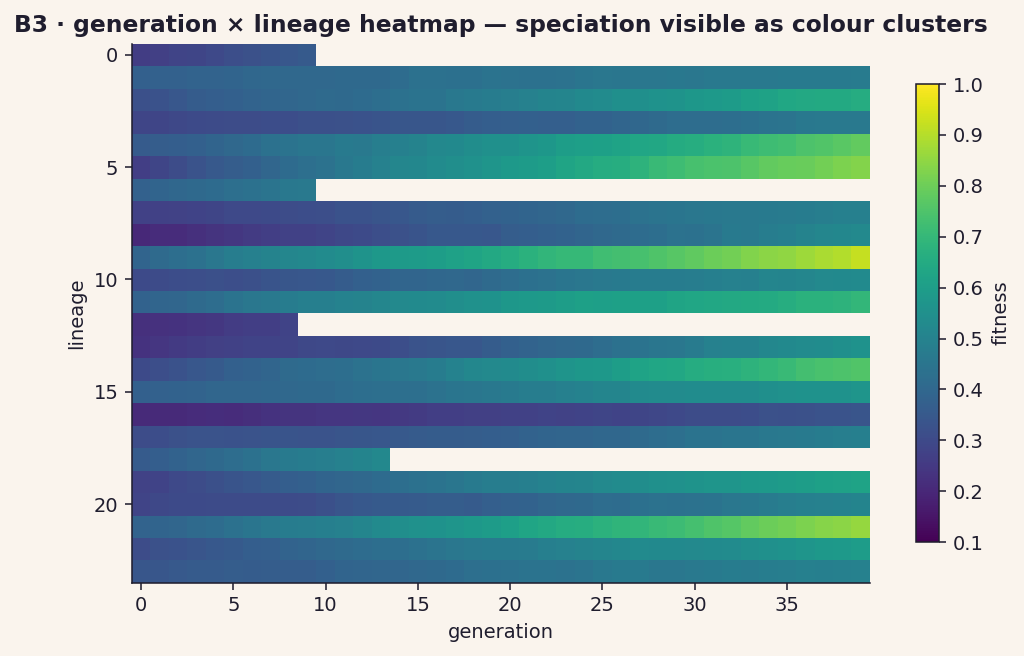
B3Generation × lineage heatmap
pub Speciation pops out as colour clusters; dead lineages as blank stripes.
B4 operator share
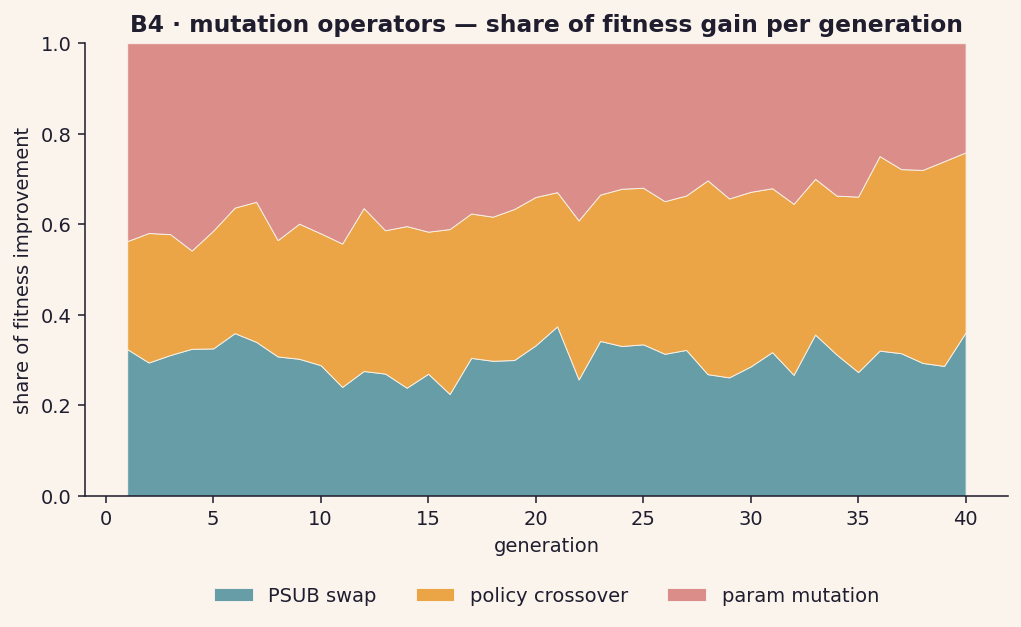
B4Mutation-operator share
pub Stackplot of which operator drove fitness gains in each generation.

CBonding curves as ALife organisms (RQ2 framing)

Makes the "curve = lifeform" claim visible. Strong for the public article and conference talk.

C1 lifecycle diorama
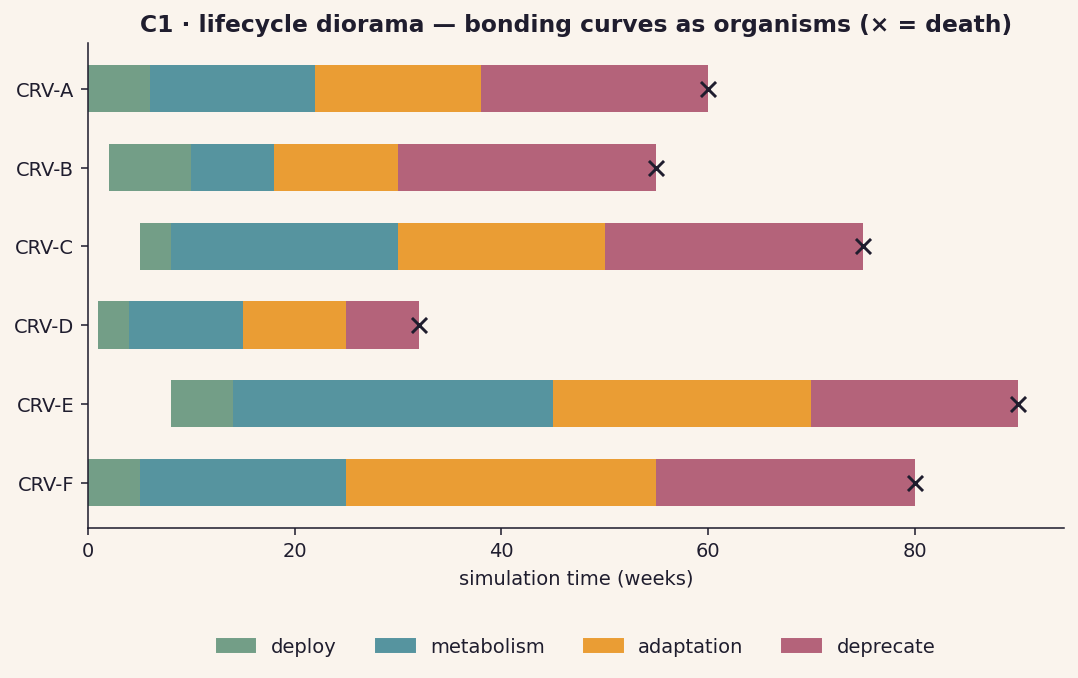
C1Lifecycle diorama
pub Gantt-style: deploy → metabolism → adaptation → deprecate, × marks death.
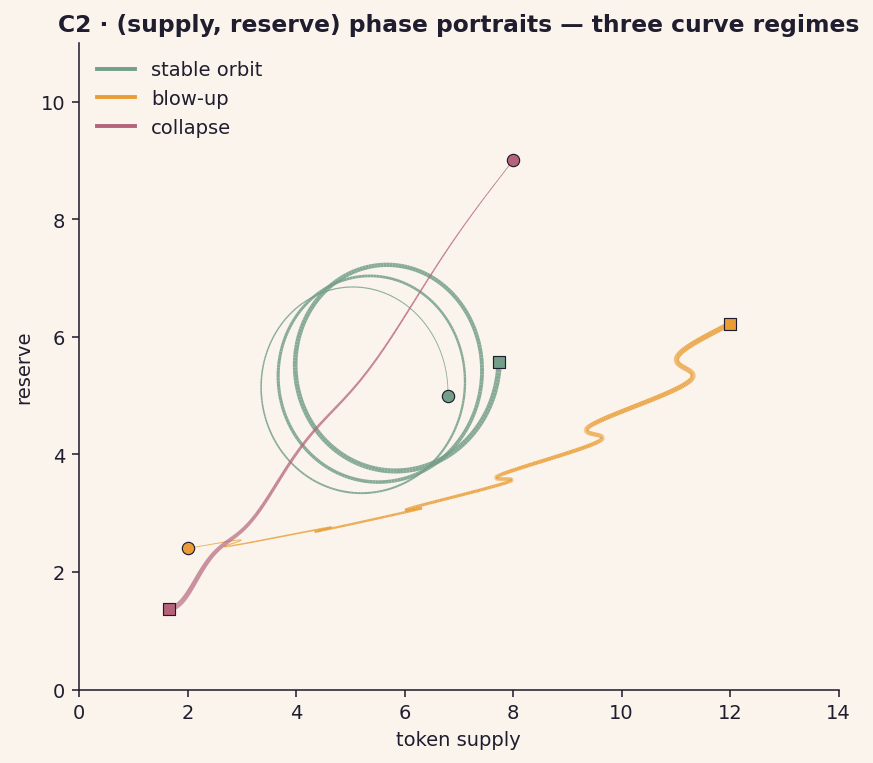
C2 phase portraits
C2(supply, reserve) phase portraits
pub Stable orbit · blow-up · collapse become distinct shapes in phase space.
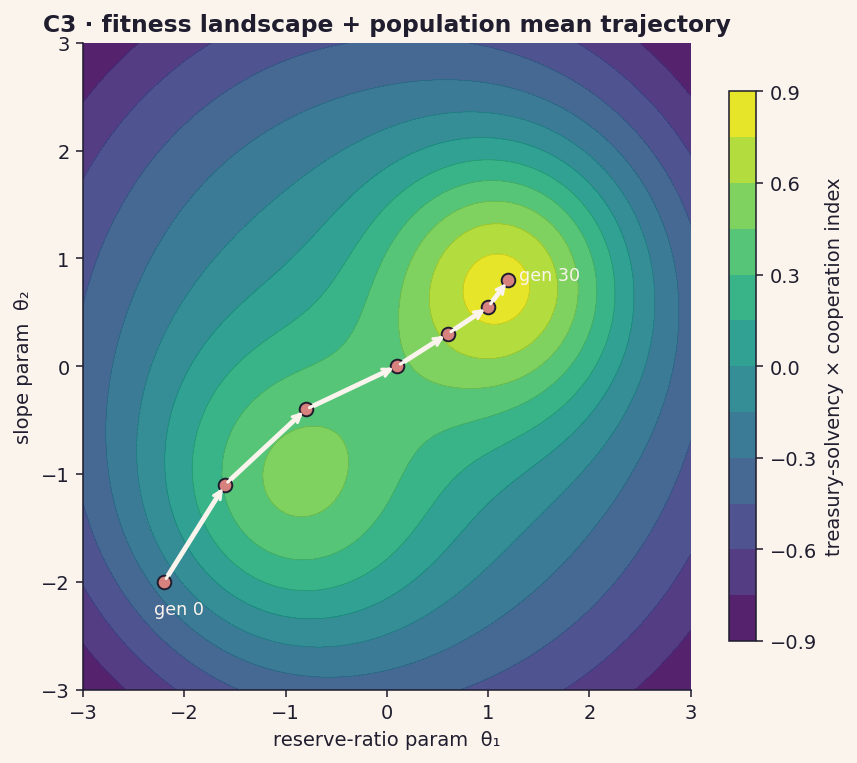
C3 fitness landscape
C3Fitness landscape + trajectory
pub Population mean drifting up the gradient over generations.
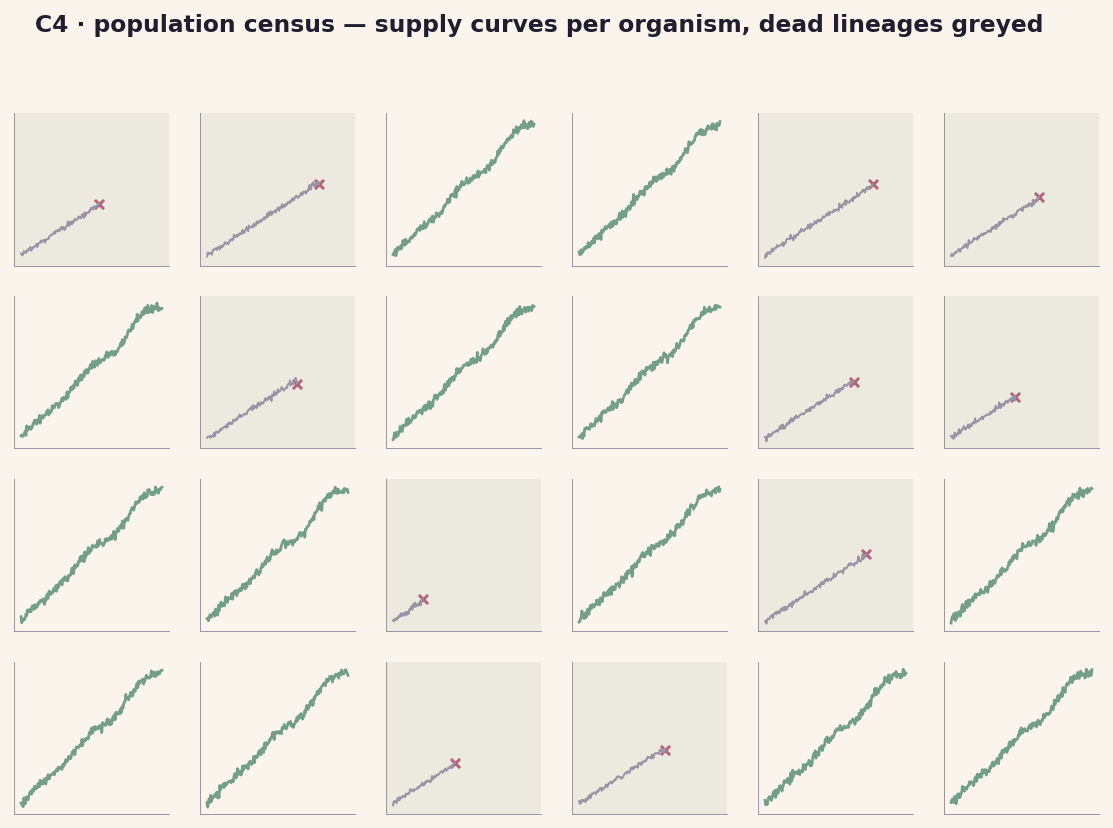
C4 population census
C4Population census
pub Small-multiples; survivors in colour, dead lineages greyed with × at time of death.

DActive-inference agents (Active Blockference, Cycle 5)

Validates the active-inference mapping. These are the figures the IWAI/pymdp community will look at first.

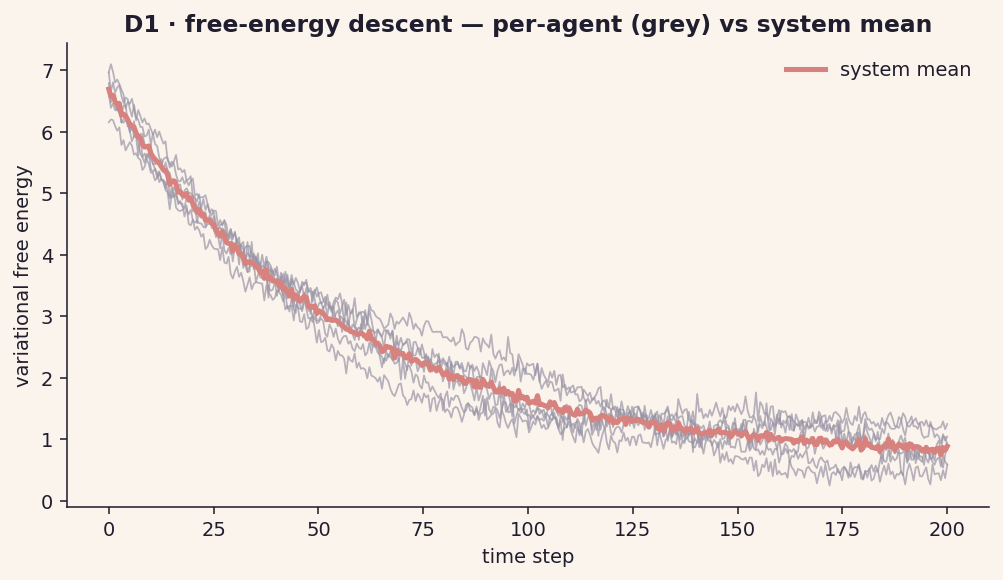
D1 free energy
D1Free-energy descent
pub Per-agent (grey) and system mean (bold). The single claim of the framework, shown.
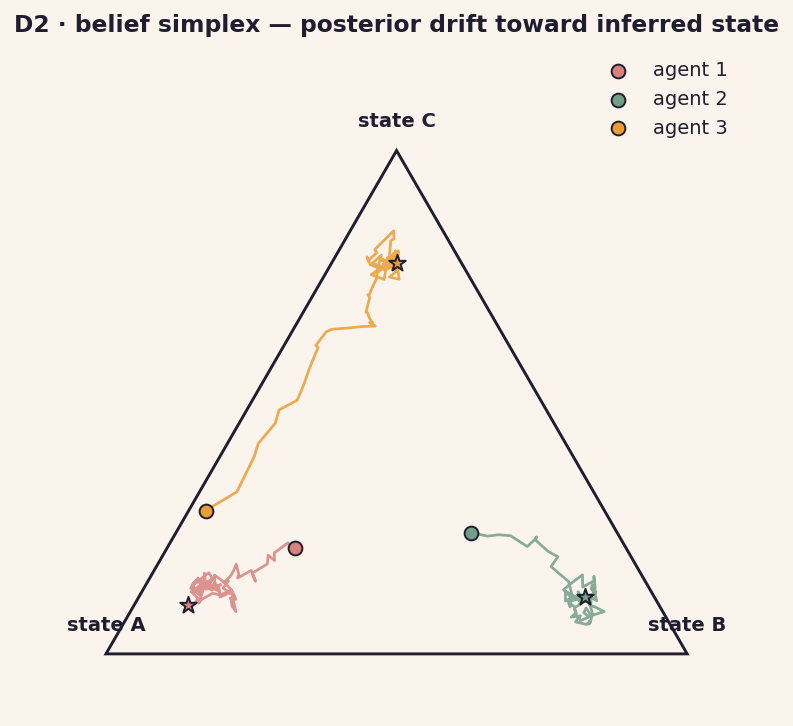
D2 belief simplex
D2Belief simplex trajectories
pub Posteriors drifting toward inferred states. Very pretty, very on-brand.
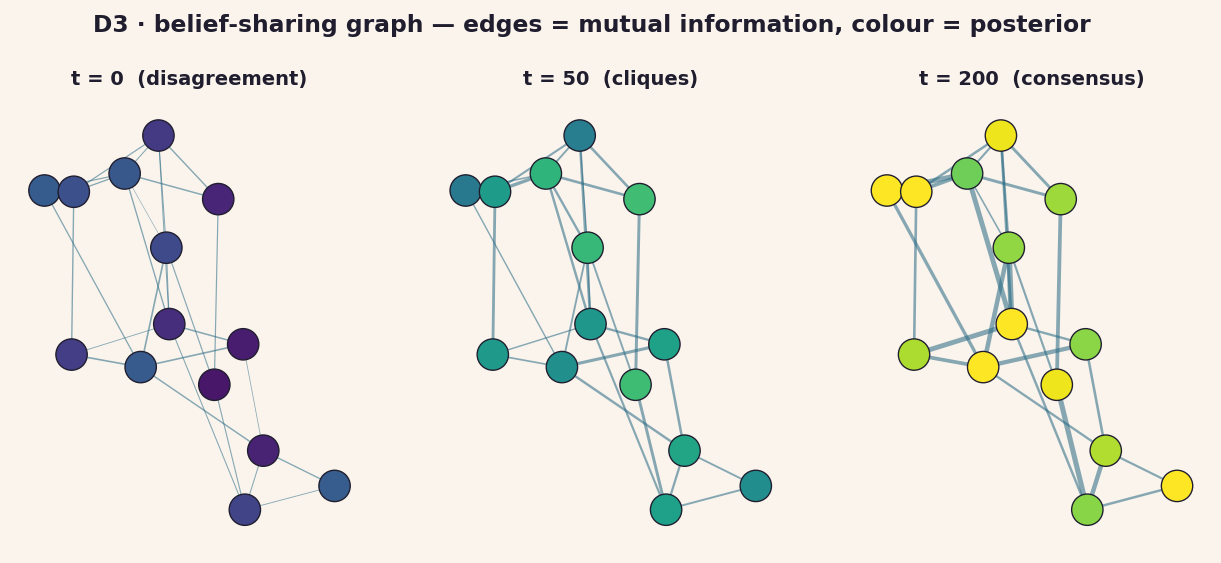
D3 belief-sharing graph
D3Belief-sharing graph
pub Three time-slices; coordination crystallizes without a central controller.
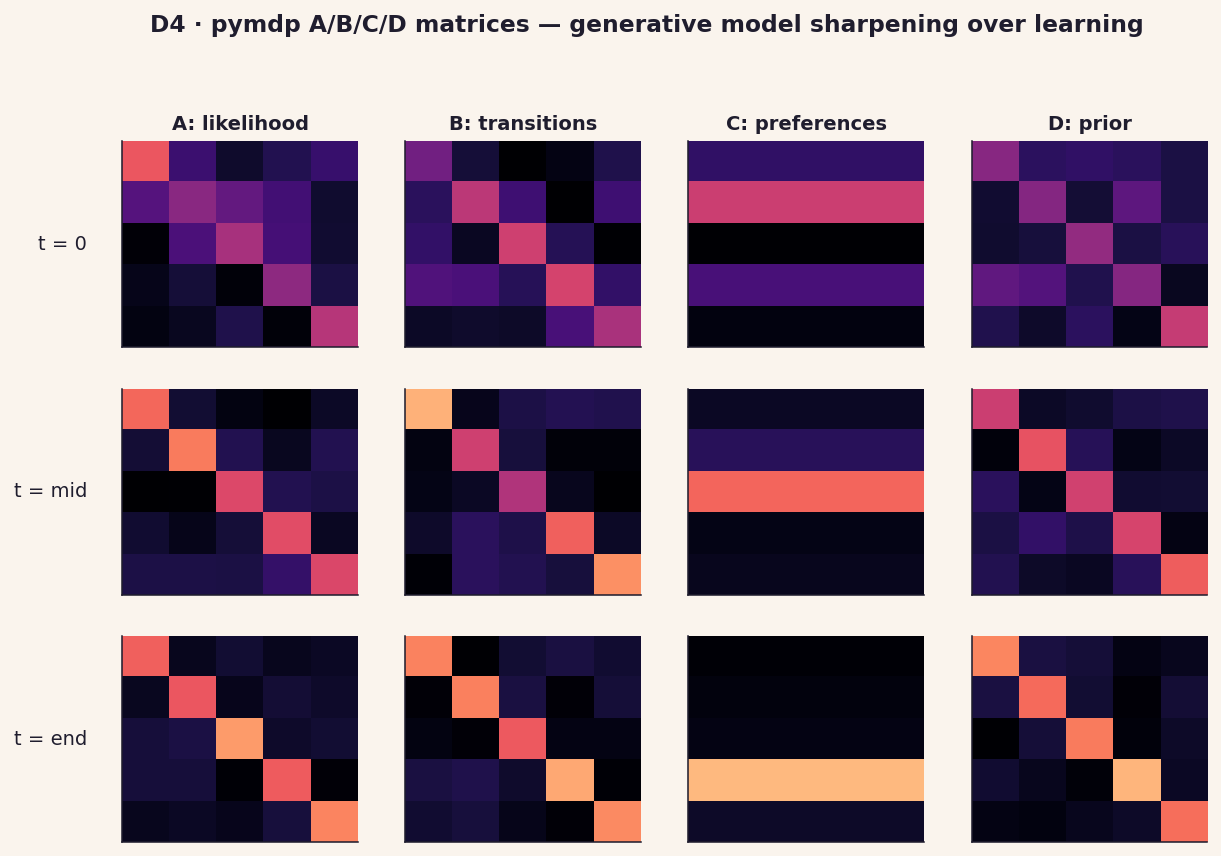
D4 A/B/C/D matrices
D4pymdp A/B/C/D matrices
pub Small-multiples of the generative-model matrices sharpening over learning.

ECross-cutting / publication

Composite assets — paper hero, reproducibility receipts, live dashboard for the public article.

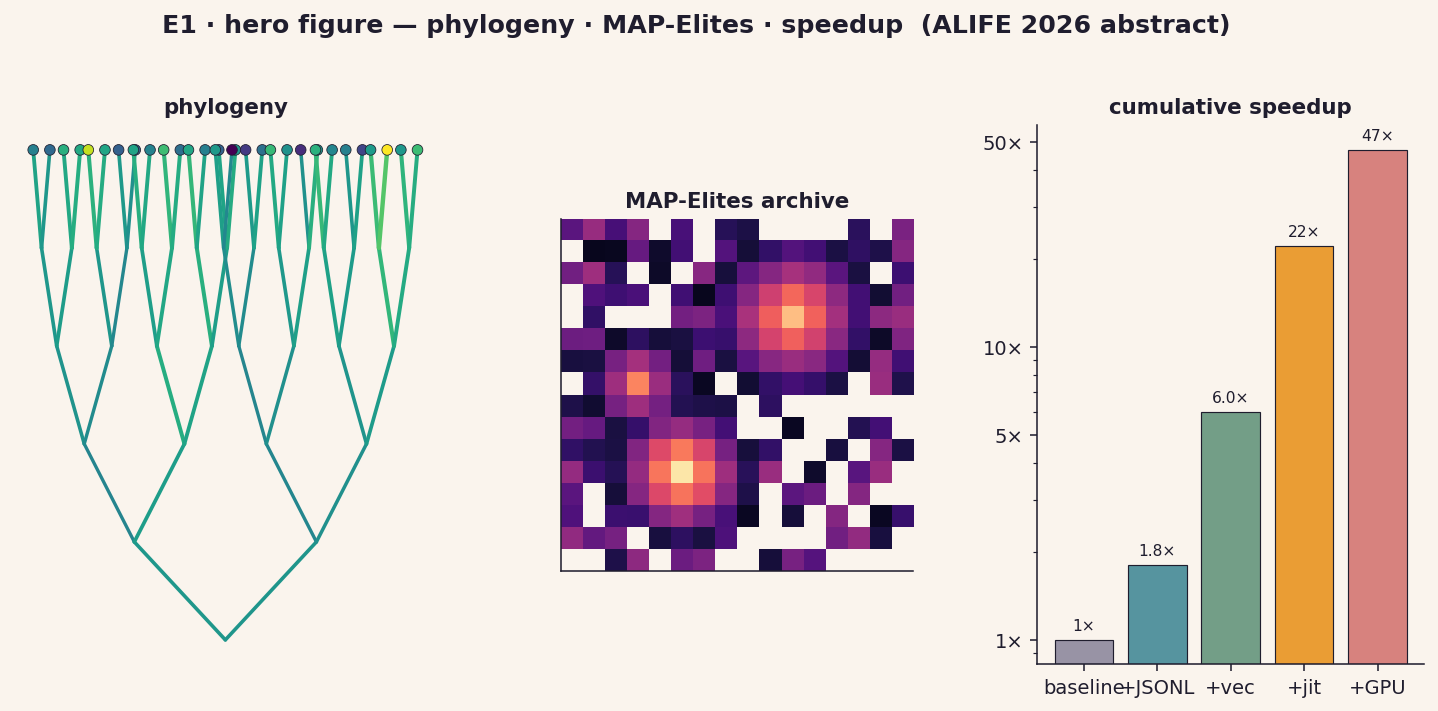
E1 hero
E1Hero figure — phylogeny · MAP-Elites · speedup
pub One image for the ALIFE 2026 abstract / repo README banner.
E2 repro receipt
E2Reproducibility-receipt strip
pub Seed · commit · config · hw · runtime — appended under every published figure.
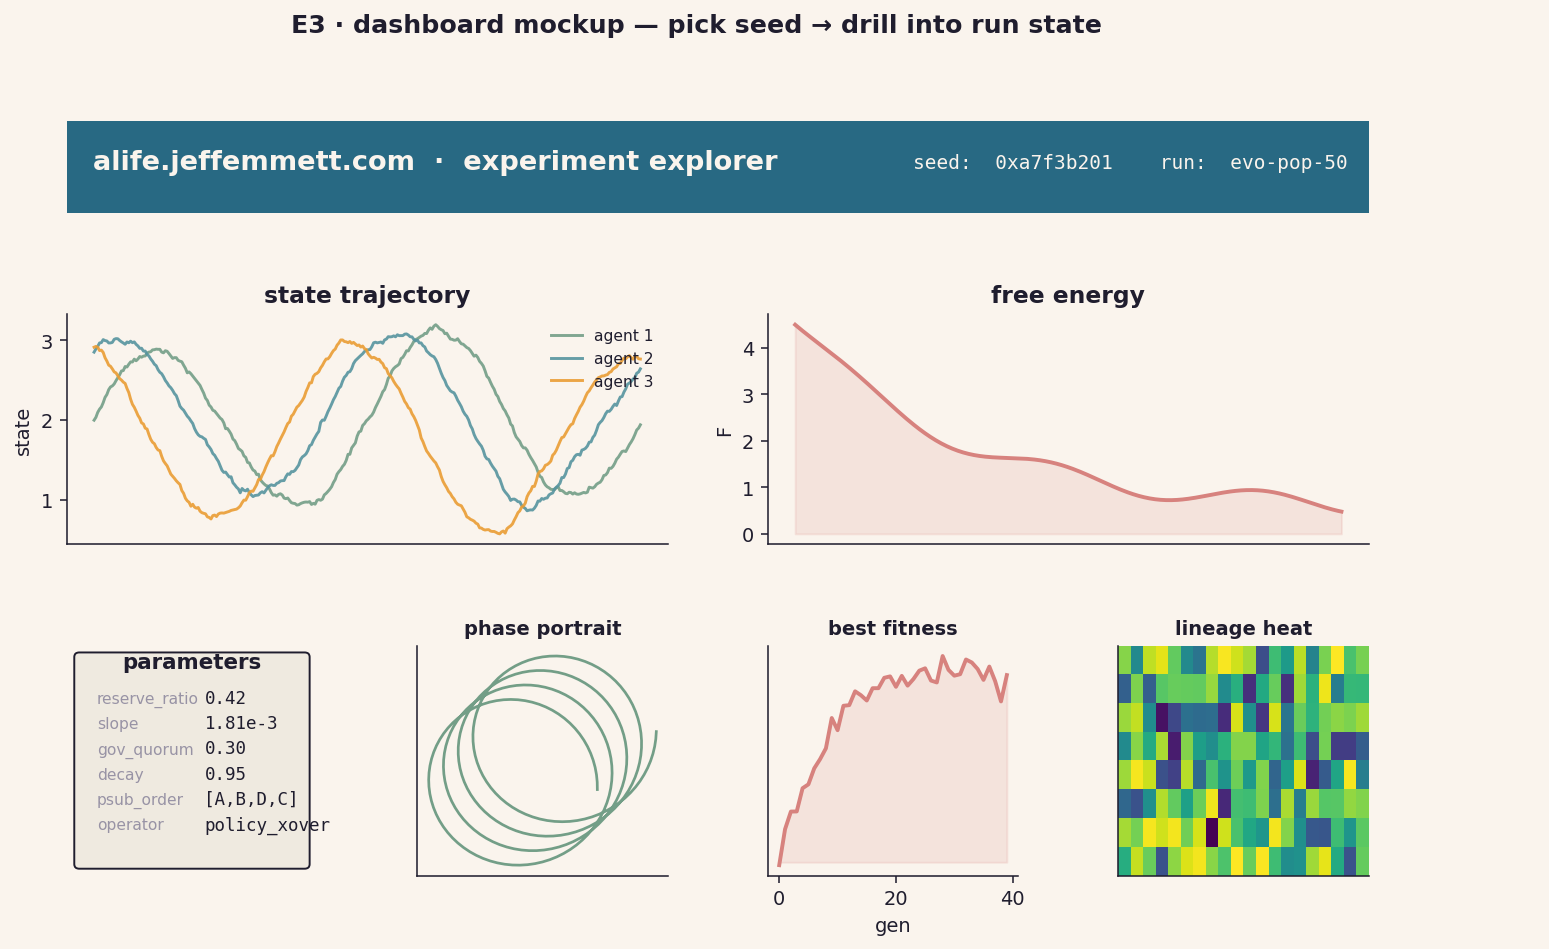
E3 dashboard
E3Dashboard mockup
live Streamlit / Panel target — drill from seed to state to free-energy to params. Could host at alife.jeffemmett.com.