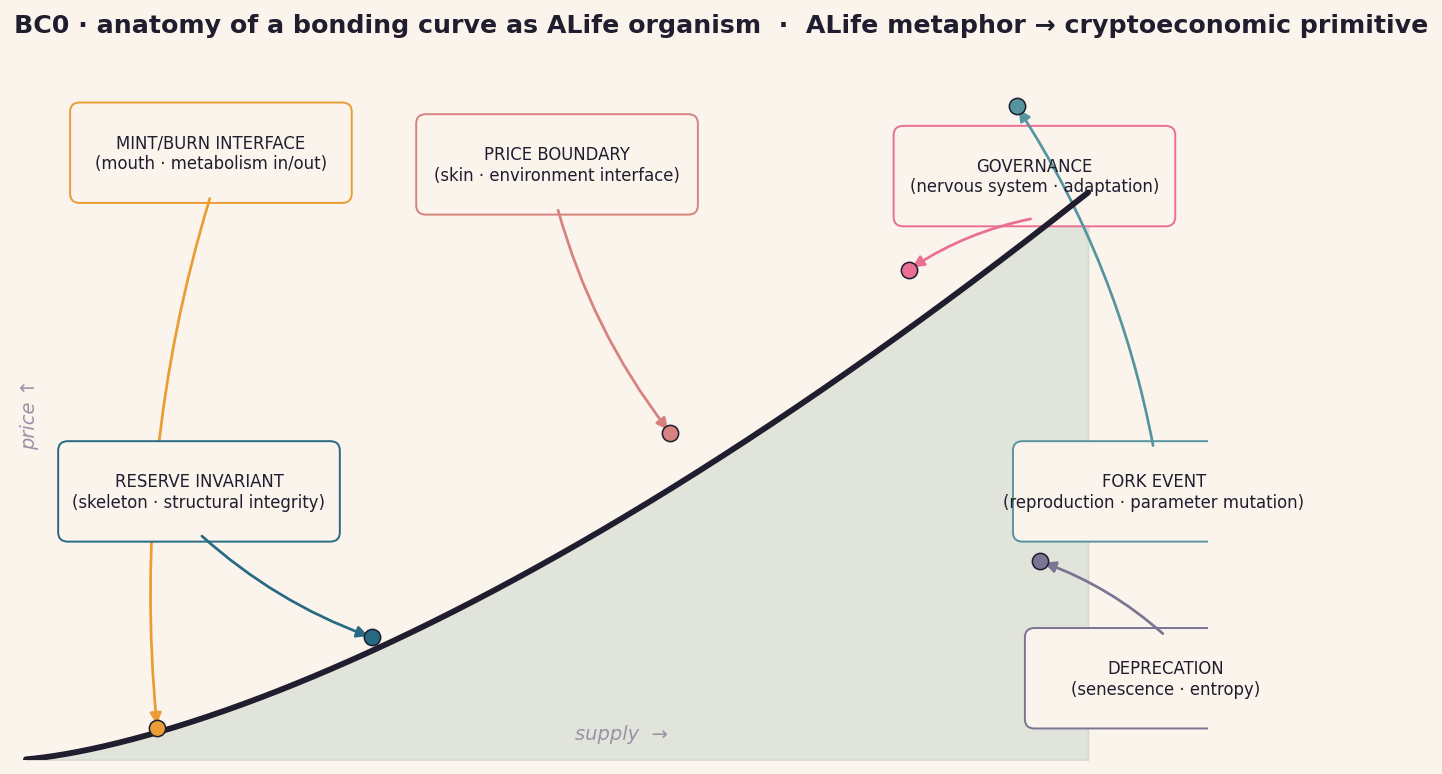
Visualization gallery for RQ2 of the cadCAD Foundation research proposal.
Each figure maps an ALife / cybernetics concept onto a bonding-curve
mechanic, grounded in the ALIFE 2025 papers in ../../Papers/.
→ Deep dive: BC2-BC8 expansion — 21 supporting figures + mechanism, cadCAD wiring, plausible findings, paper anchors for each of the seven topics.
Establishes the metaphor with a single illustrative organism. These are the figures that go in the abstract, the public article intro, and the conference-talk first slide.
anatomy Annotated schematic of the canonical price-supply curve with each mechanism labeled as an organ: mint/burn = mouth, reserve invariant = skeleton, price boundary = skin, governance = nervous system, fork = reproduction.
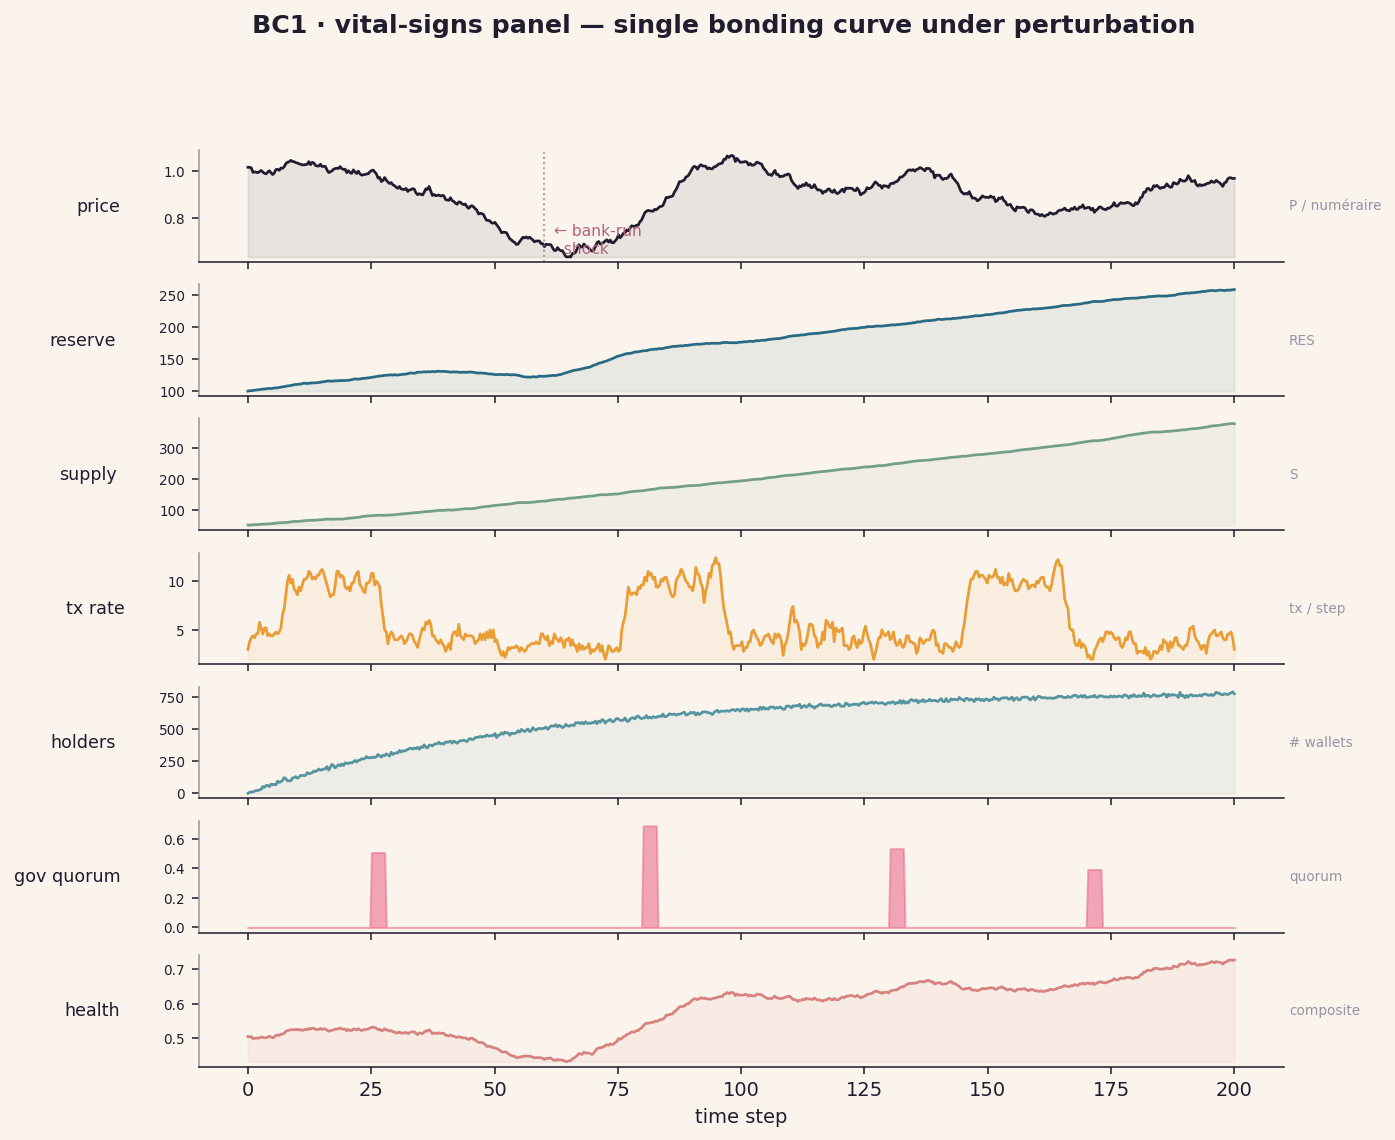
vitals Hospital-monitor view of a single curve: price, reserve, supply, tx rate, holders, gov-quorum, composite health — across a shock event. Reads as "is this organism well?" at a glance.
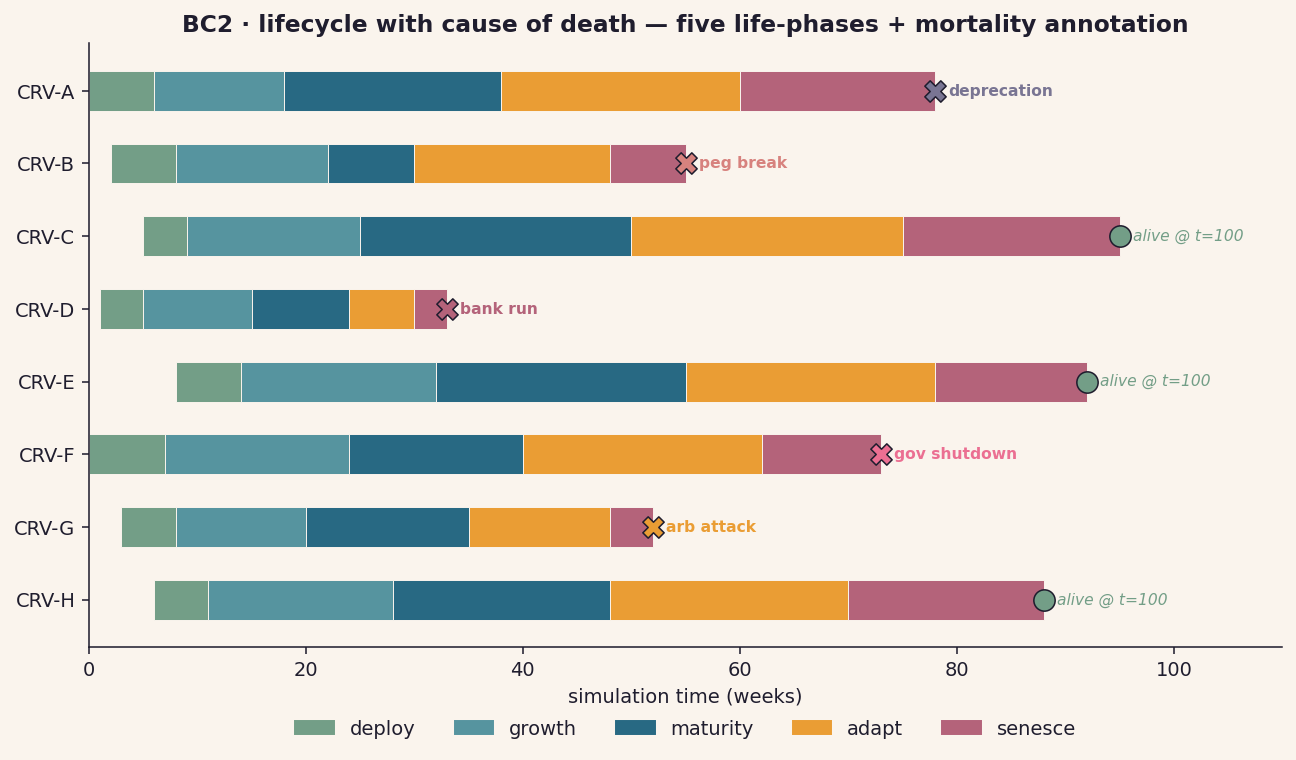
vitals Eight organisms across five life-phases (deploy · growth · maturity · adapt · senescence) with mortality annotated by cause (bank run, peg break, gov shutdown, arb attack, deprecation).
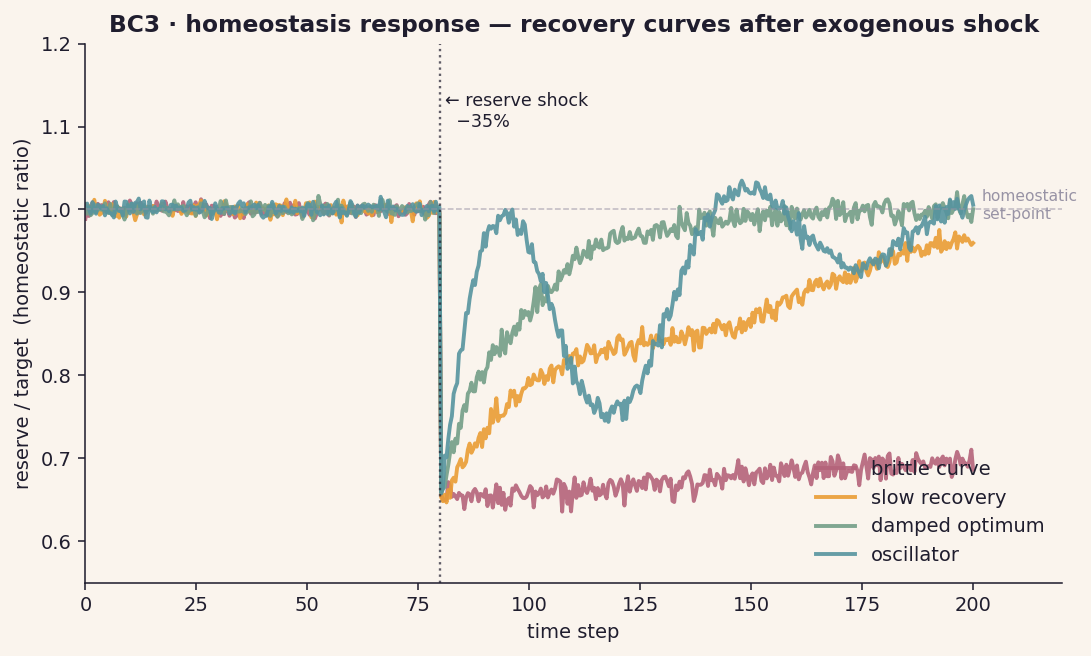
vitals Reserve / target ratio plotted post-shock for four curve archetypes (brittle, slow recovery, damped optimum, oscillator). Operationalizes "is this curve a viable organism?" as a measurable recovery-time signature.
Moves from single organism to multi-curve dynamics. The proposal's most novel contribution lives here: treating an ecosystem of curves as an ALife population.
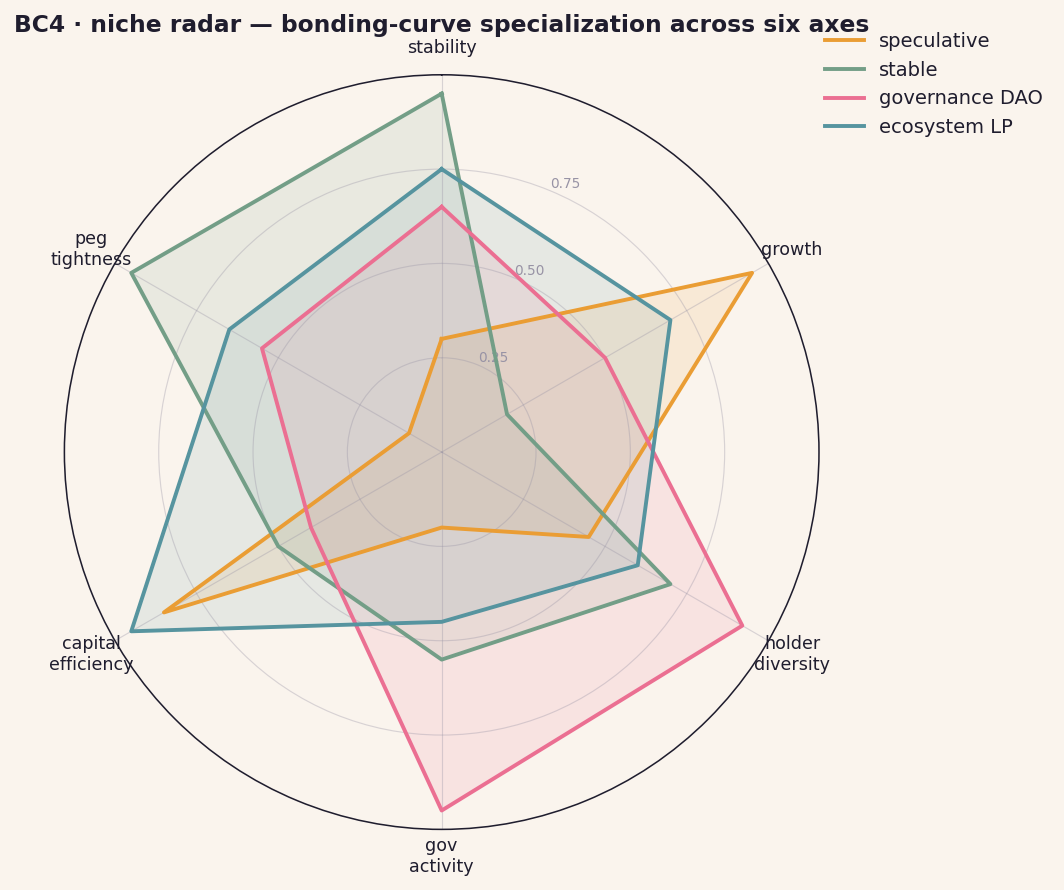
ecology Four curve archetypes (speculative · stable · gov DAO · ecosystem LP) on six trait axes. Shape-recognition makes niche differentiation immediate and intuitive.
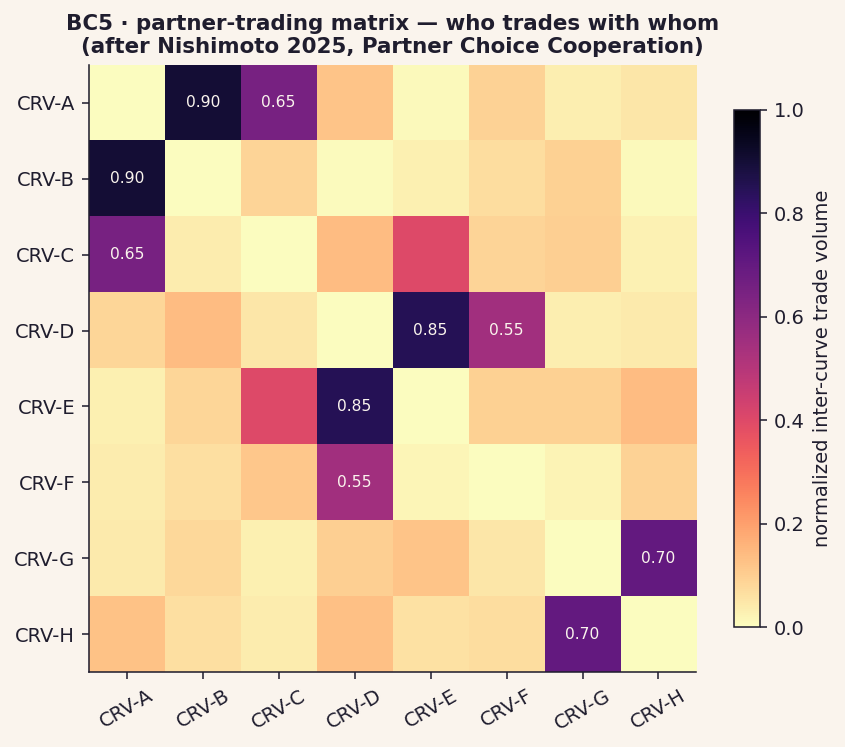
ecology Inter-curve trade-volume heatmap reveals trading cliques and bridge-curves. Same instrument the ALife community uses to study partner-choice cooperation in agent populations.
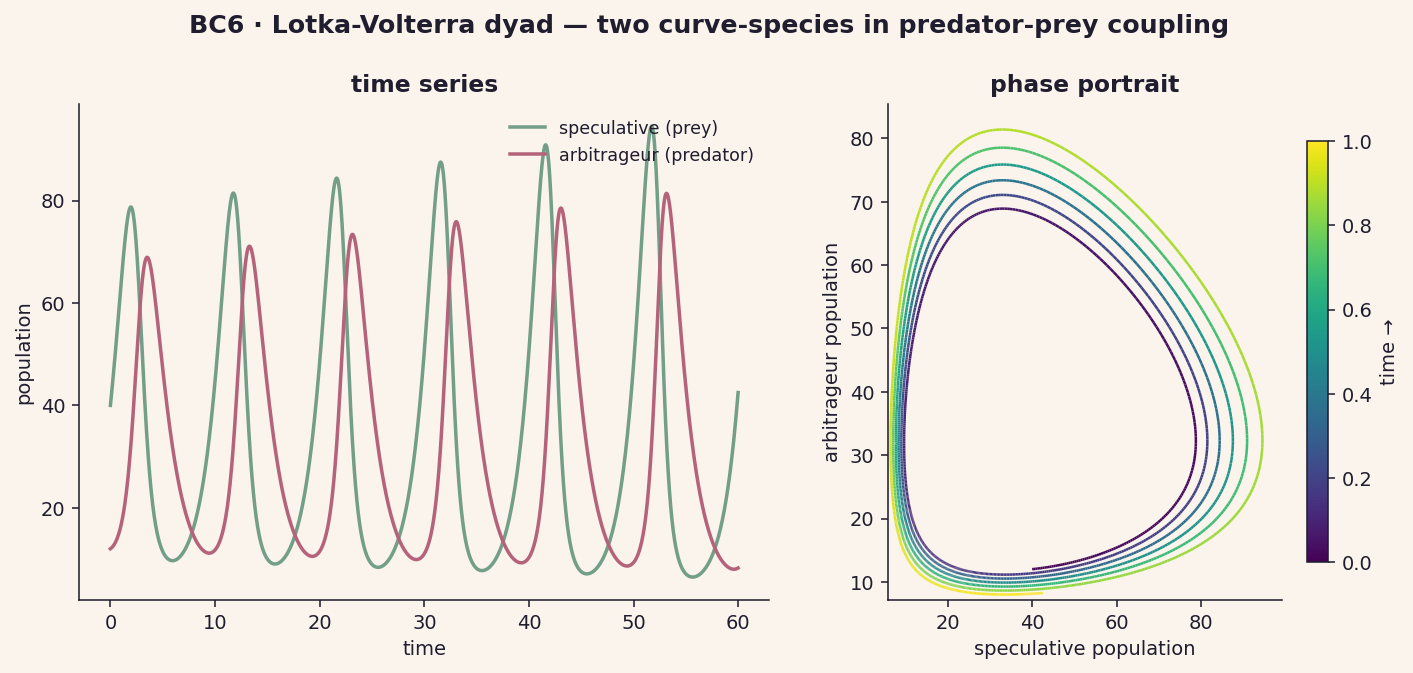
ecology Speculative curves (prey) vs arbitrageur curves (predator) coupled through cross-trading. Time series + phase portrait — the textbook ALife/eco visualization with a crypto interpretation.
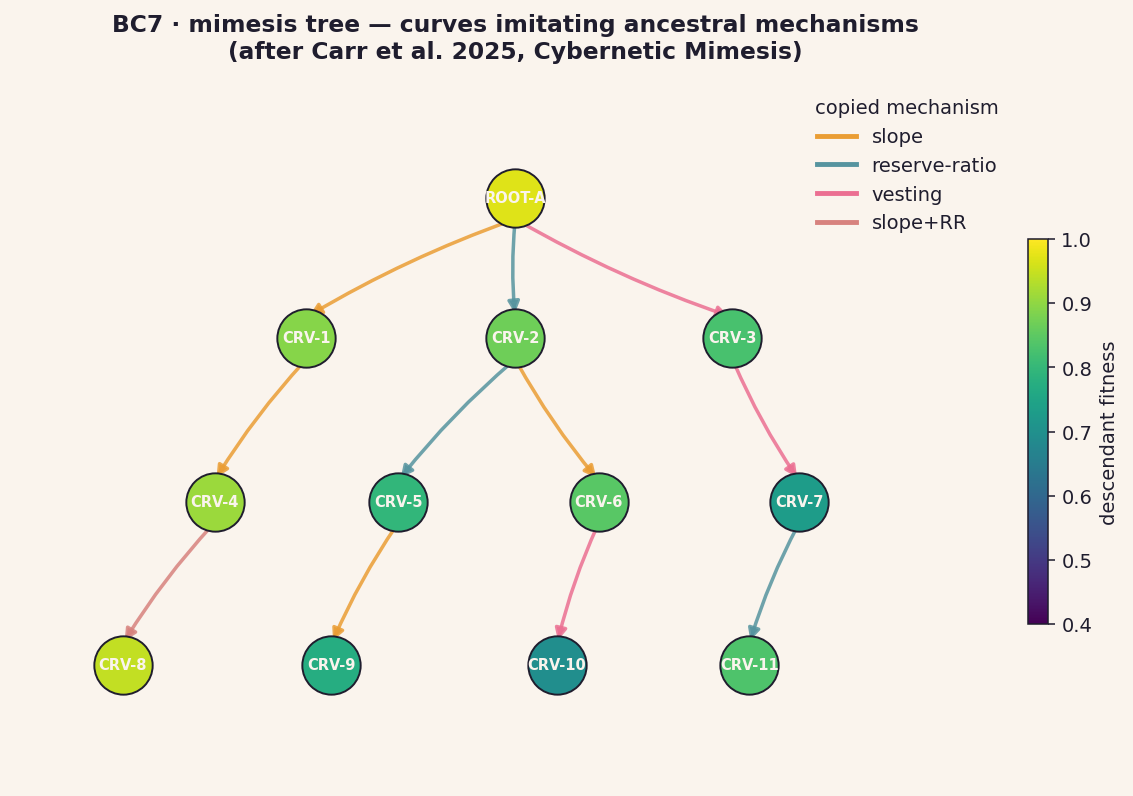
ecology Directed graph of curves with copy-edges colored by the imitated mechanism (slope, reserve-ratio, vesting, combos). Node colour = descendant fitness. Visual claim: imitation tracks the fitness gradient in the curve population.
Where the cadCAD evolutionary-search engine (RQ1) and the bonding-curve framing (RQ2) meet. These are the figures that justify the M2 milestone results in the technical report.
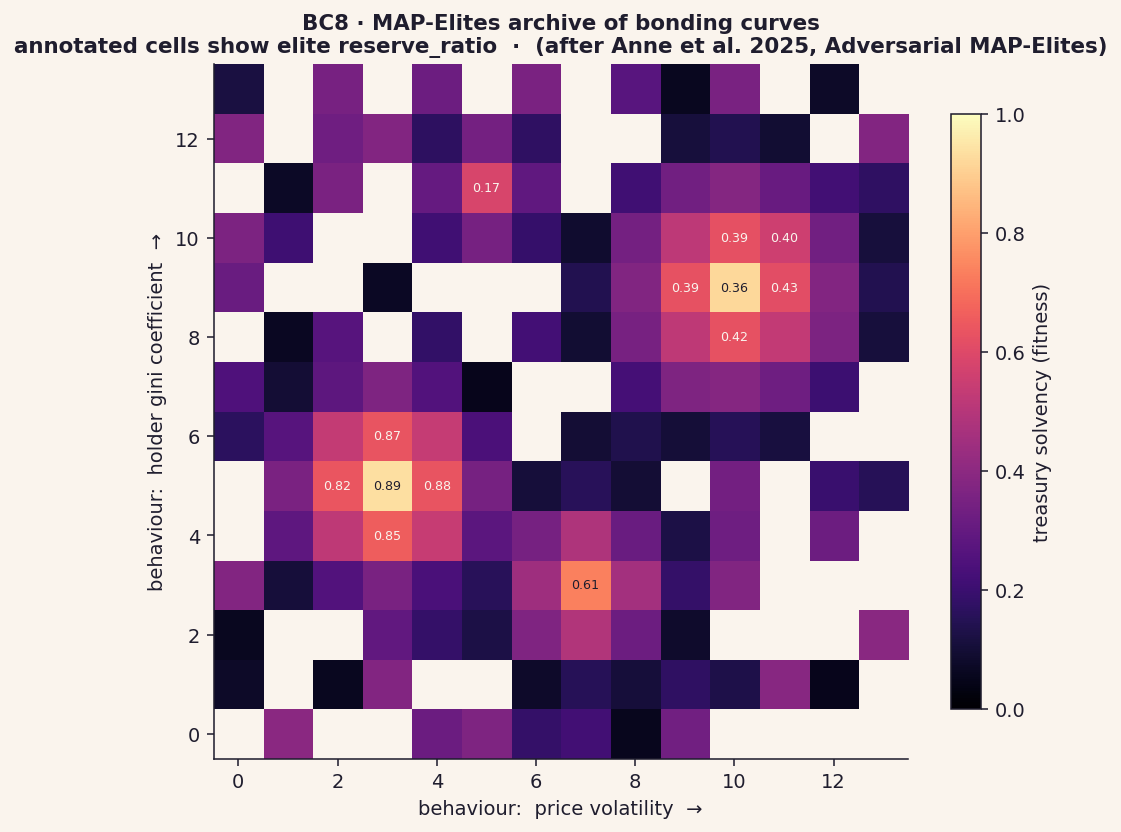
evolution Behaviour-space tiled by (price volatility × holder gini), colour = treasury-solvency fitness, cell text = elite reserve_ratio param. One figure shows discovery, diversity, and parameter-prescription.
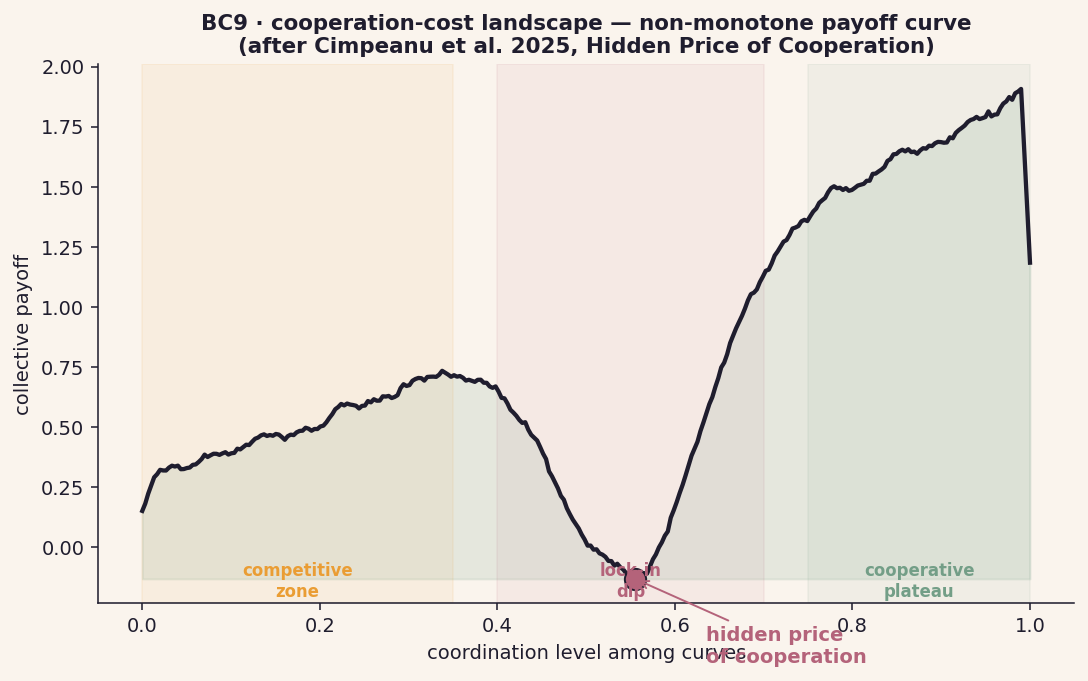
evolution Non-monotone payoff curve across coordination level — the "lock-in dip" between competitive and cooperative regimes shows up explicitly. Directly answers: does multi-curve coordination always pay?
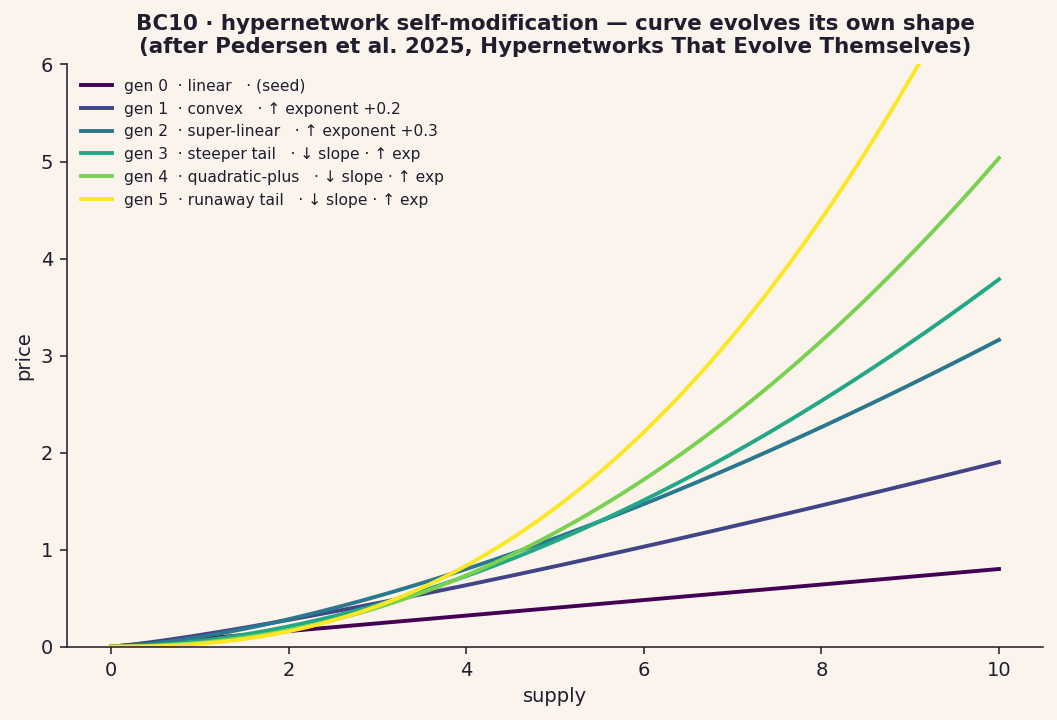
evolution Six generations of one curve under a meta-policy that modifies its own slope/exponent each step. Mutation annotation per generation makes the self-improvement loop legible — the curve isn't just evolved; it evolves itself.
The death side of the lifeform metaphor. Borrows clinical-research language (survival analysis) for crypto and produces the clearest "this is biology" framing.
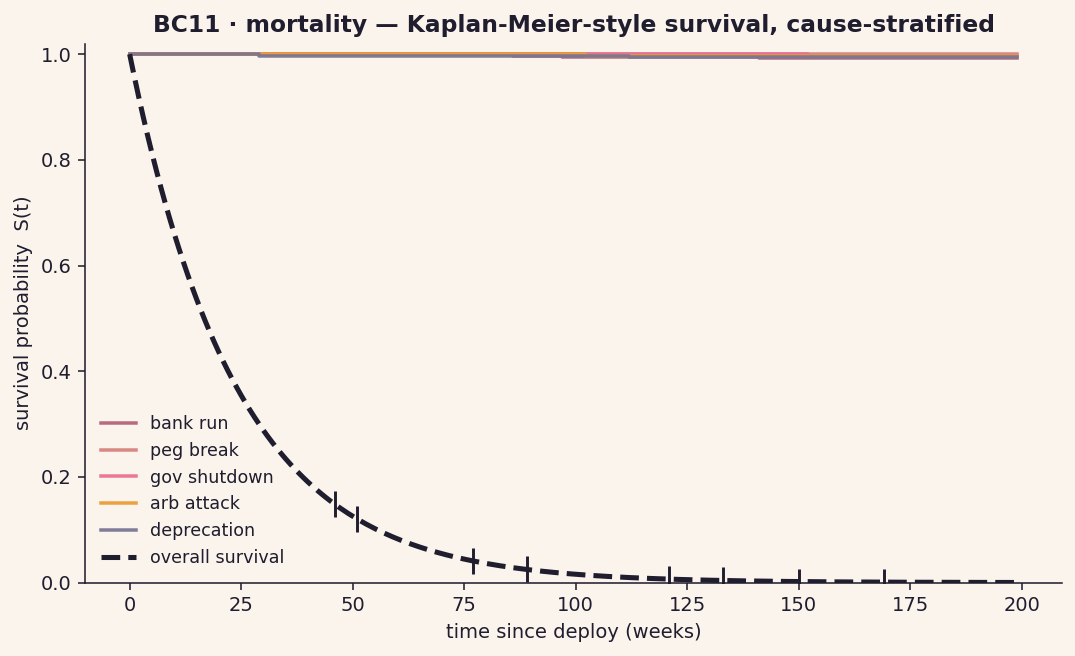
mortality Stepwise survival probability over time, stratified by cause of death + censoring marks for surviving cohorts. Operationalizes the "death" half of the metaphor in a rigorous statistical instrument.
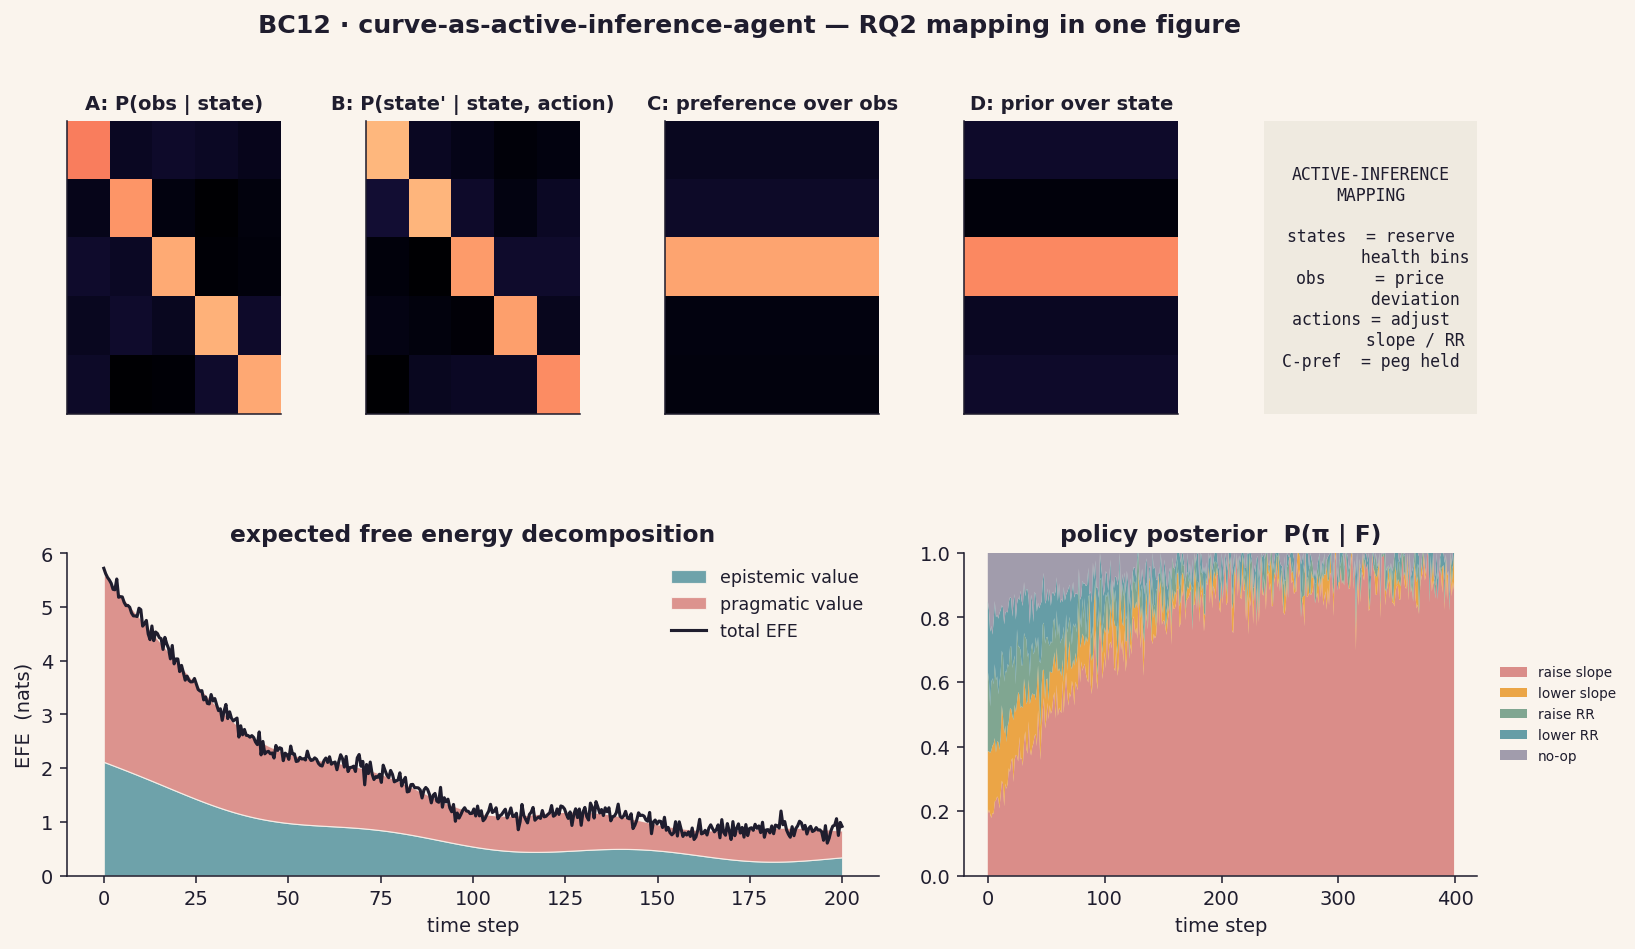
The figure that closes the RQ2 loop: a single bonding curve fully reframed as a pymdp / Active Blockference agent. Anchors the proposal's theoretical claim in one image.
agent Composite: pymdp A/B/C/D generative-model matrices, the active-inference mapping (states / observations / actions / preferences spelled out), expected-free-energy decomposition into epistemic and pragmatic value, and the converging policy posterior.
Three suggestions for what to prioritise, given target audiences.
BC0 anatomy + BC8 MAP-Elites + BC11 mortality. Three slots covering the metaphor, the empirical engine, and the lifeform claim.
BC0 anatomy + BC2 lifecycle + BC6 Lotka-Volterra. The accessible-then-vivid trio — anatomy frames it, lifecycle makes it concrete, predator-prey sells the eco-system claim to non-specialists.
BC3 homeostasis + BC8 MAP-Elites + BC12 curve-as-agent. Hard claims: stability is measurable, evolution discovered specific elites, active-inference bridge is concrete.